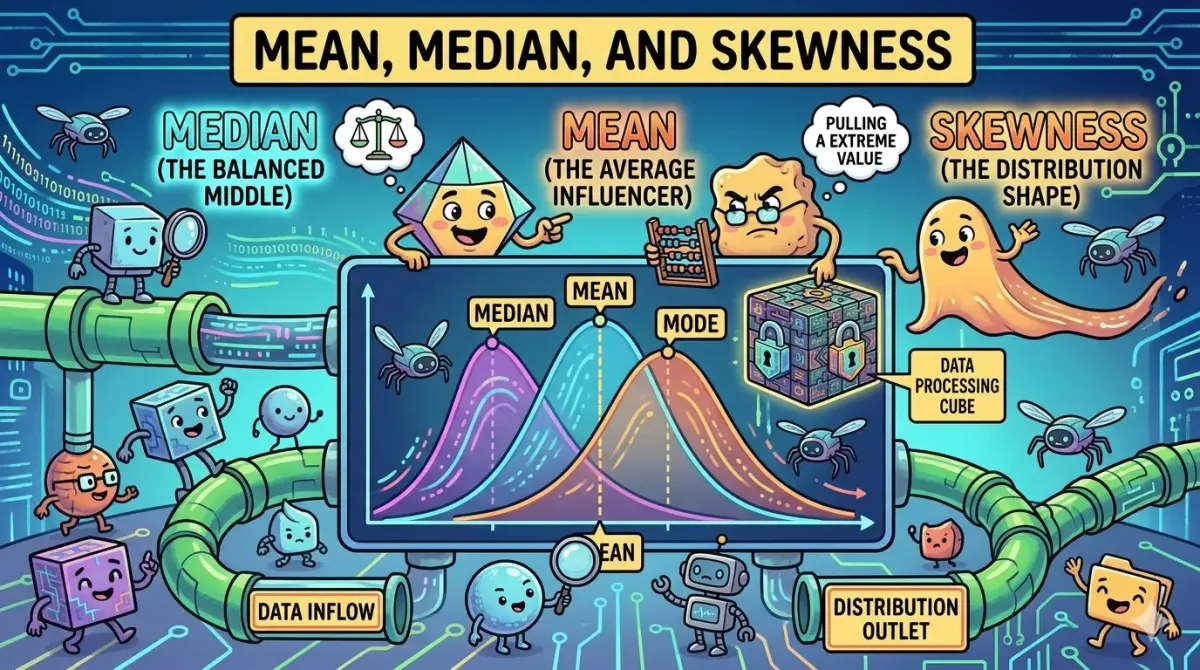
Mean, Median and Skewness
We have learned statistics from school to university. I am now learning it for my MSc as well, but I never had a clear picture of the whole subject. Today, while going through some lecture material, I gained a better understanding of mean, median, skewness, and distributions. I am glad to write it here and share it with others. Even if no one reads this, I can revisit it later to refresh my understanding.
Dataset Example
Let’s consider a dataset of ages of selected people:
24, 25, 26, 27, 28, 29, 30, 32, 34, 37, 40, 45, 50
So, what are the median and mean?
Understanding the Median
Basically, the median represents the middle value.
If we ask,
“What is the age of the person in the middle when we arrange all ages in ascending order?”,
the answer is the median.
To find the median, we identify the middle person. Here, there are 13 people, so the middle position is:
Middle position = (13 + 1) / 2 = 7
That means the 7th person in the ordered list is the median, which is 30. The “+1” in the formula is used to correctly identify the middle position when counting from both ends.
Understanding the Mean
If we ask,
“What is the average age of a person?”,
the answer is the mean.
To calculate the mean, we sum all the ages and divide by the number of people:
Mean = (24 + 25 + 26 + 27 + 28 + 29 + 30 + 32 + 34 + 37 + 40 + 45 + 50) / 13 ≈ 32.85
Visualizing Distributions
If we draw a diagram for this distribution,

we can visualize it like a metal bar. Imagine the bar is not perfectly weight-balanced. It has a middle point, but you may not be able to balance it by placing your finger exactly at the middle. The balance point (gravitational point) depends on how the weight is distributed:
- If more weight is on the right, your finger must move to the right to balance it.
- If the weight is evenly distributed, the balance point is the middle.
- If more weight is on the left, your finger must move left.
Here, the middle point represents the median, and the balance point represents the mean.
Skewness of a Distribution
- If the mean is to the right of the median, the distribution is right-skewed.
- If the mean is to the left of the median, the distribution is left-skewed.
- If the mean and median coincide, the distribution is symmetric.
In other words:
- Mean > Median → Right-skewed (longer tail on the right)
- Mean < Median → Left-skewed (longer tail on the left)
- Mean ≈ Median → Symmetric (balanced on both sides)
Important Notes on Mean vs Median
Just because the mean is higher than the median, it does not mean there are more data points on the right side. The median ensures that exactly half the data is on each side. However, a longer tail to the right (which pulls the mean) indicates higher variance.
Variance measures how far values deviate from the mean. So, when a distribution has a long tail, we can say the variance is higher, but we cannot conclude that there is more data in that tail — only that some values are farther from the mean.